
A guide for school staff.
The GPA & Scores report ranks your students by GPA or percentage score for the terms you choose, so you can quickly find your top performers — or the students who need support.
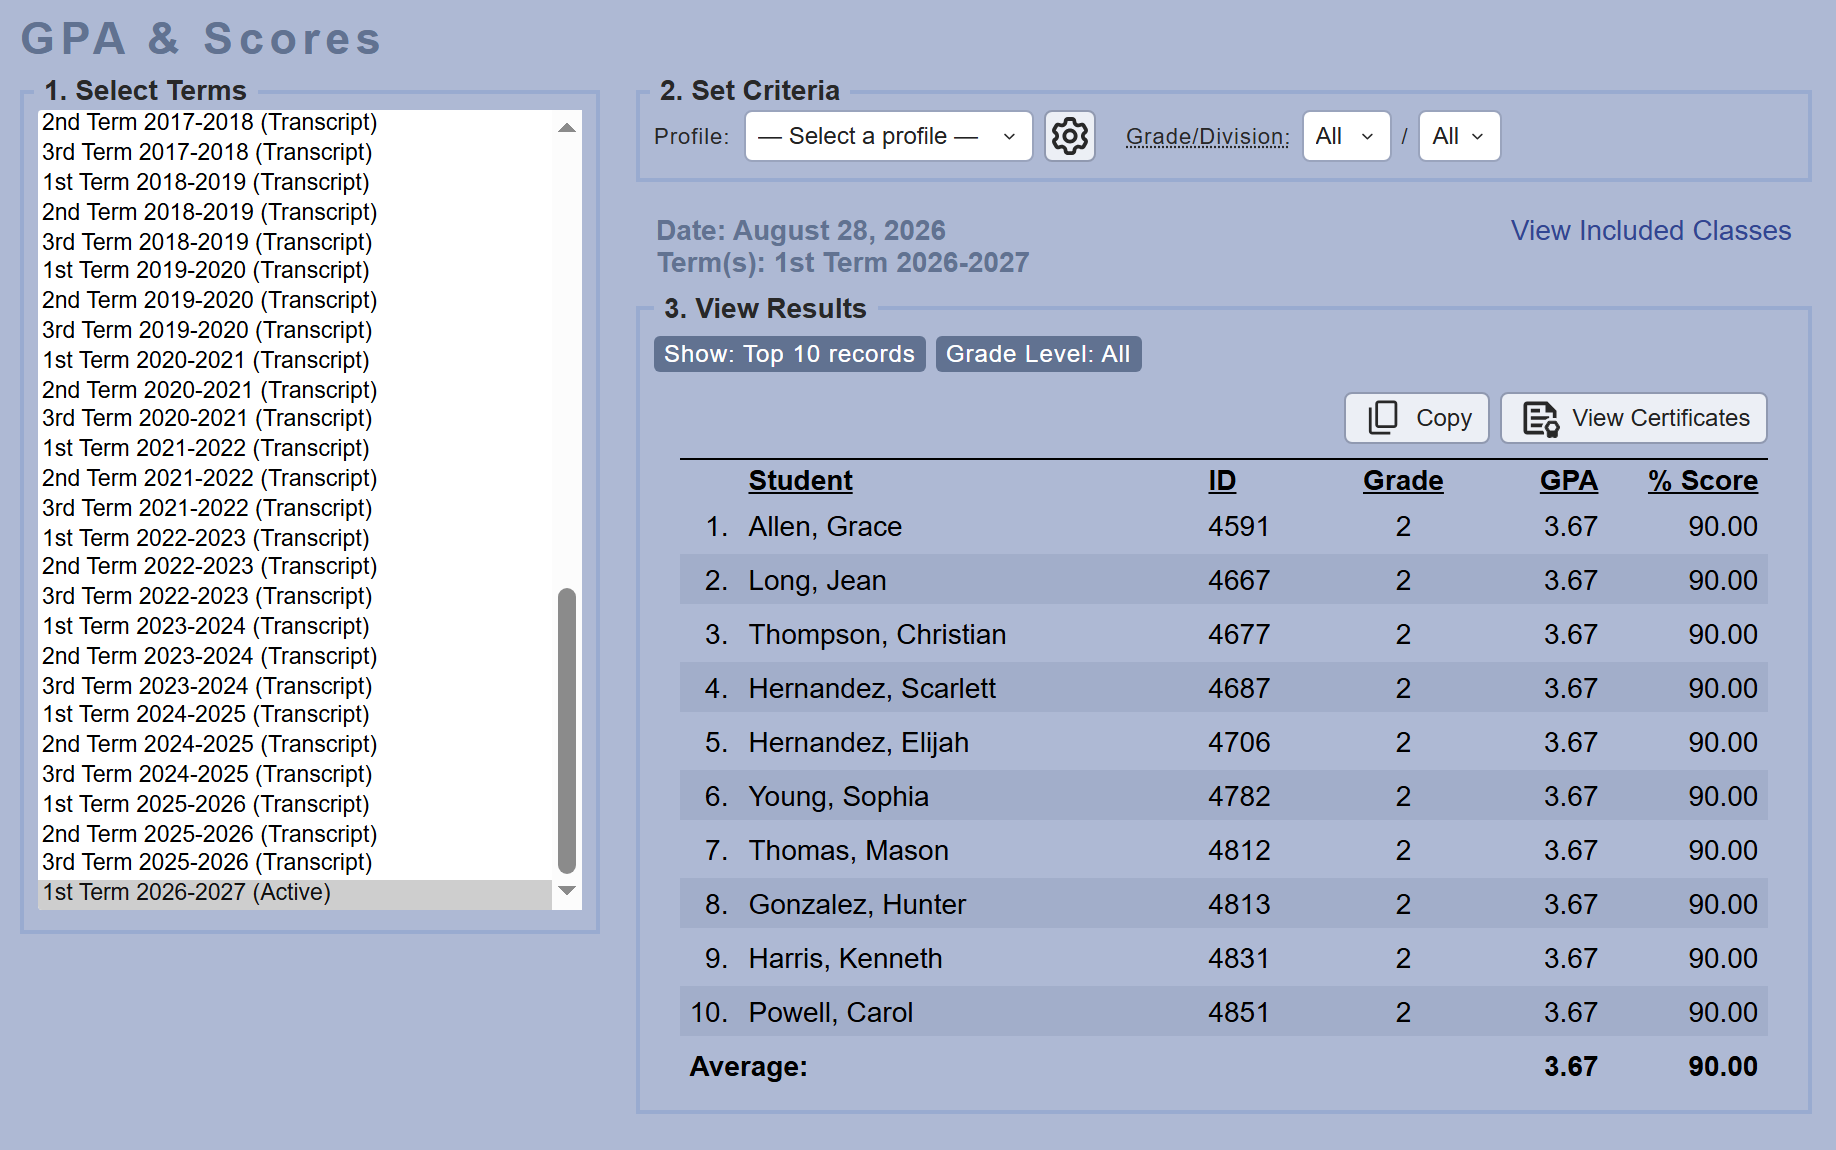
1. Run the report
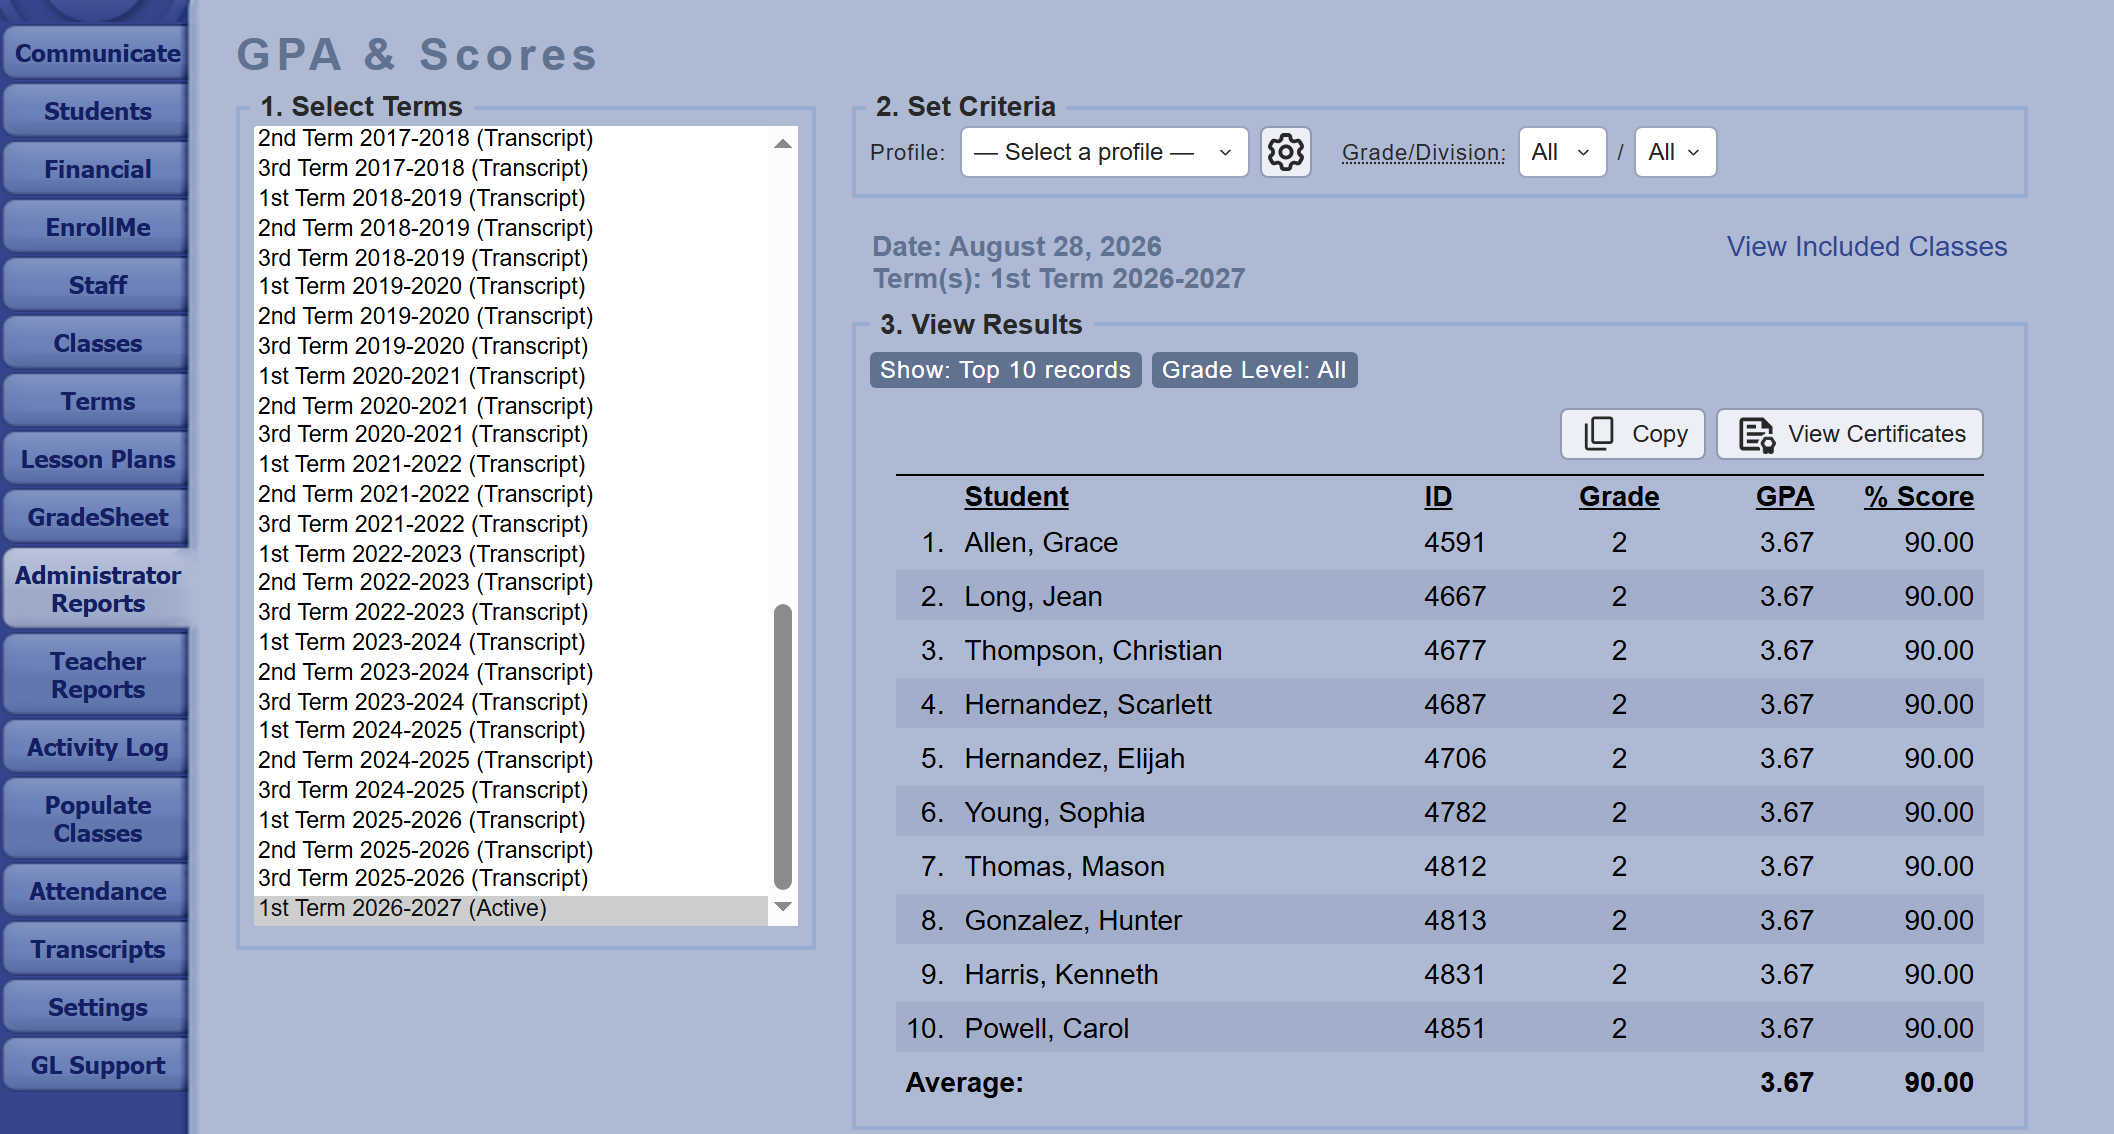 1 2 3 4
- 1Go to Administrator Reports and click GPA & Scores to access the report.
- 2Select Term(s) — To include more than one term, hold Ctrl (Windows) or
Cmd (Mac) while you click. - 3Set Criteria, pick a saved profile, then choose a grade level and division.
- 4View Results updates automatically.
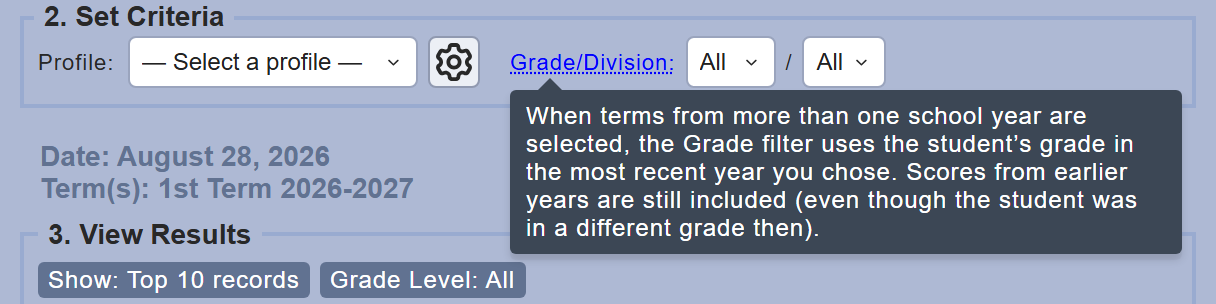
Hovering over labels with a dotted underline provides more explanation.
2. Use report profiles
A profile saves a complete set of report settings so you can run the same report again in one click. Choose one from the Profile: list and the report runs right away.
Three ready-made profiles are included:
- Principal's List — students with a GPA of 4.0 or higher.
- High Honors — students with a GPA from 3.5 to 3.99.
- Honor Roll — students with a GPA from 3.0 to 3.49.
If your school grades by percentage instead of GPA, these profiles use percentage ranges instead.
3. Create or edit a profile
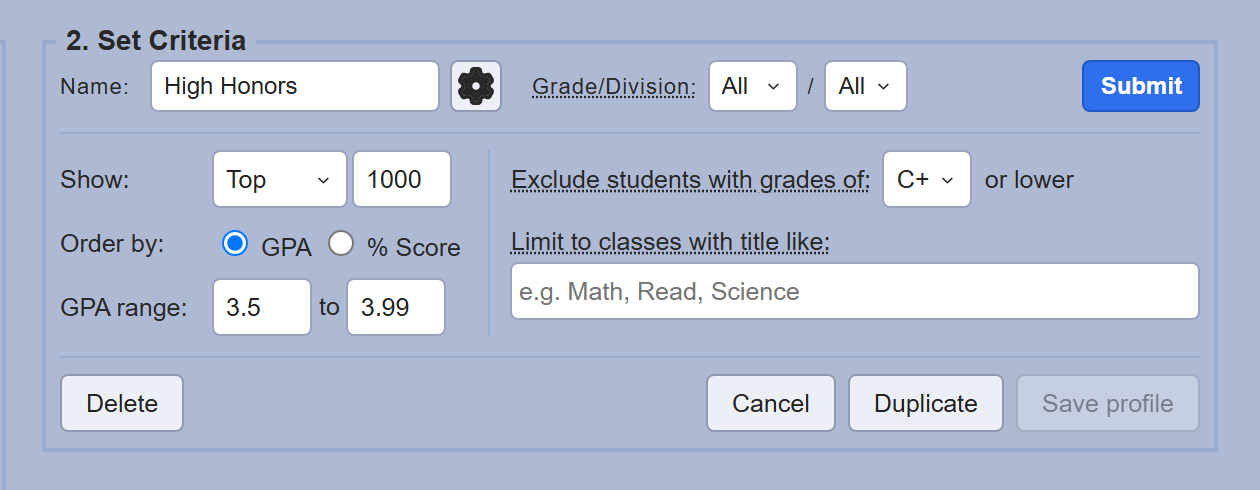
Click the gear button next to the Profile: list to open the profile's settings. Each setting below matches its number in the picture.
 1 2 3 4 5 6 7
- 1Name: — the profile's name as it appears in the list.
- 2Show: — list the Top or Bottom students, and how many to list (up to 1,000).
- 3Order by: — rank students by GPA or by % Score.
- 4GPA range: — only include students whose GPA falls between these two values. Leave a box empty for no limit. When you rank by % Score, this becomes Percentage range:.
- 5Exclude students with grades of: — leave out any student who received this grade or lower in any class. The exclusion only applies to classes whose grade scale includes the symbol you choose.
- 6Limit to classes with title like: — count only classes whose titles match what you type, such as “Math” or “Science”. You can enter up to 10 titles separated by commas.
- 7Click Save profile to keep your changes.
The other buttons in the settings panel:
- Duplicate — makes a copy of the current profile, ready to rename and adjust.
- Delete — removes the profile. You are asked to confirm first.
- Cancel — closes the settings without saving your changes.
- Submit — runs the report with the settings shown, without saving them.
4. Read the results
The gray tags above the table repeat the criteria the report ran with, so you always see how the list was filtered. Date: and Term(s): show when the report ran and which terms it covers. The Average: row at the bottom shows the average GPA and % Score of the students listed.
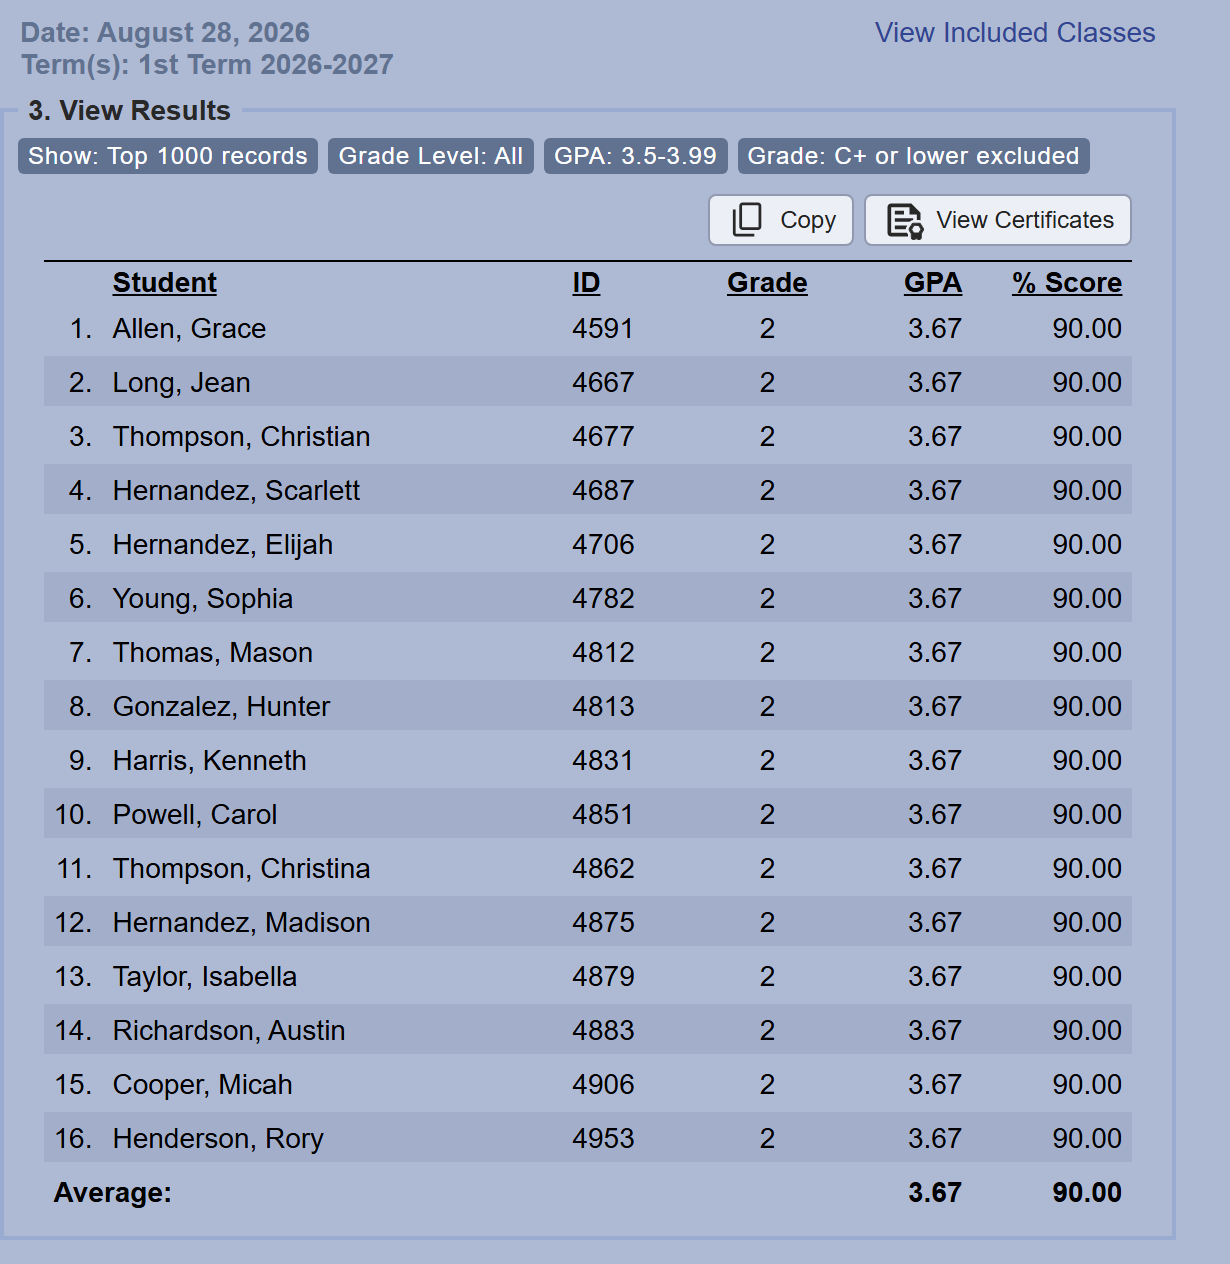
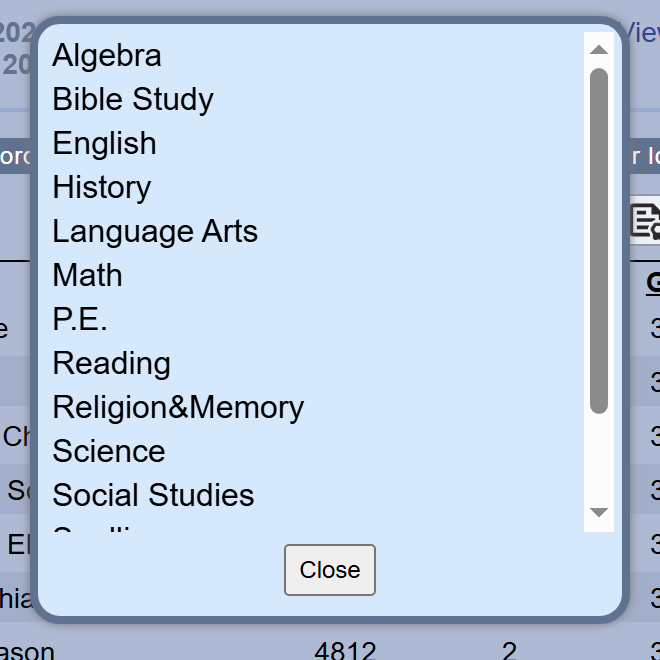
Click View Included Classes above the table to see which classes count toward the GPA and score calculations for the terms you selected.
Click Close to return to the report.
5. Copy the results
Click Copy above the table to copy the whole report to your clipboard — the title, the criteria, and every row. Then paste it into a spreadsheet or document. A green Copied message confirms the copy.
Finding Valedictorian and/or list students by class rank
- Select the grade level of your seniors such as “8” or “12”
- Select the last few grading periods such as the last four years if you want to list High School seniors by class rank. A K-8 school can select any number of years they want to report on.
- Press “submit”
If you selected 12th graders, Gradelink will find all the active 12th graders from the most recent semester and lookup their average GPA across the past four years. The students will be listed in order either by GPA or percentage grade (whichever you choose). When selecting terms from multiple years, if you filter by a grade level (such as 12th grade), Gradelink will only consider students who are in 12th grade during the most recent term. Gradelink will ignore students who were in 12th grade during prior years. For example, if you select 12th graders and the years 2010-2014, Gradelink will find the GPA of students in 12th grade who are currently seniors of the 2014 year and exclude any seniors who graduated before 2014. NOTE: This functionality will only work if there are concluded classes in the current school year.
Q: Why is a student's class rank on the transcript different from their order on the GPA and Scores Report? Shouldn't they be the same?
- The reason is because “Class Rank” on the transcript compares each student to all other students based on their graduation date. This allows students who graduate at a different time then their peers to be compared separately. Class Rank also filters out students who have withdrawn.
- The GPA & Scores report lists all students in order by their GPA regardless of their graduation date and regardless of their withdrawal status. So the order isn’t necessarily their “Class Rank” thought it’s very similar most of the time.
The solution: Make sure all the students have the same graduation date. The easy way to do this is:
- Go to Students > View/Export > Roster
- Filter by the grade level
- Then filter by “blank” graduation dates.
- If you find a student with no graduation date, you can double click the record to pull up the student’s profile and edit the graduation date.
Notes & Tips:
- When selecting terms from multiple years, the grade level of the student will display the highest grade level from the selection. If you select the current academic year plus past years the student’s grade level will display their current academic year since that is the highest grade level from the selection. There must be concluded classes in the current year.
- You can filter the GPA and Scores report by subject. Enter part of the class Report Title to filter by, such as ‘Math’ or ‘Read’. Up to ten separate values can be specified, separated by commas. This allows you to find the top ‘English’ or ‘Math’ student.
- When excluding students who have a grade of X or lower, it only refers to the **Standard grade scale. Other marks such as ESNU are ignored meaning if a student has an “N” (Needs Improvement), they will not be filtered even if excluding students who have an “F” or lower.
- Note: Transcript Cumulative GPA may not match the GPA & Scores report if you use the Ignore Filter. This typically applies to High Schools, where the Transcript includes 9th-12th grade classes and a student who took a 9th grade class while in 8th Grade. The GPA & Scores report will only reflect the selected terms while the Transcript will include any classes that are “high school” classes. If you select 5 years in the GPA & Scores report, it will reflect all the classes from 8th grade while the transcript only reflects 8th grade classes that have the Ignore Filter set.